Five-Year Civil International Air Traffic
(April 2015 – March 2020)
| Fiscal Year | Aircraft Movement | Passenger * | Commercial Cargo | |||
|---|---|---|---|---|---|---|
| Movement | % Change (from last fiscal year) |
Number | % Change (from last fiscal year) |
Tonnes | % Change (from last fiscal year) |
|
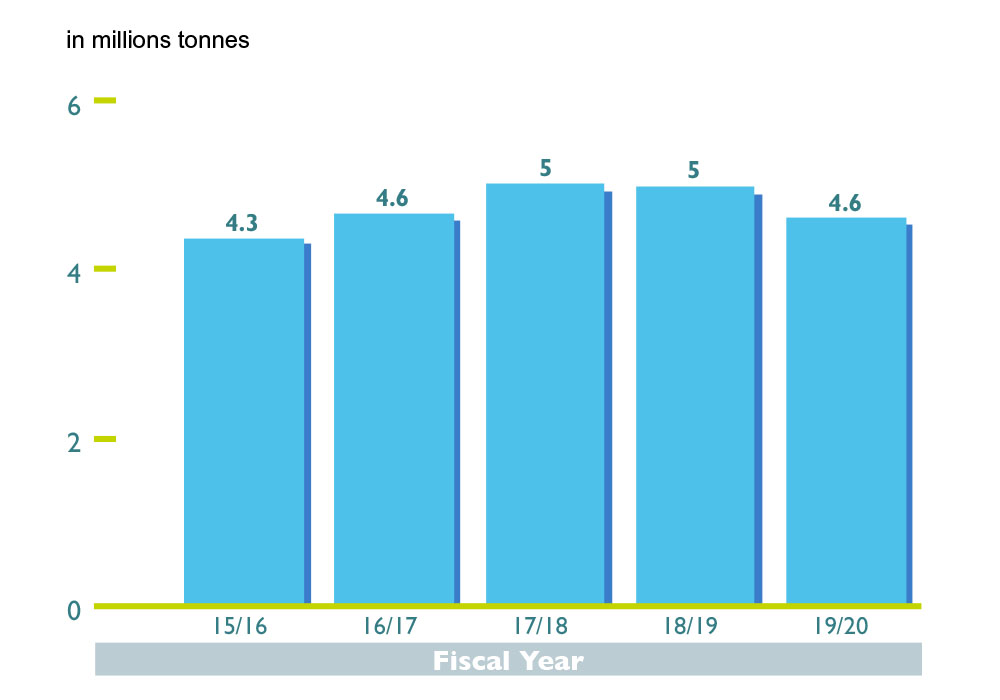
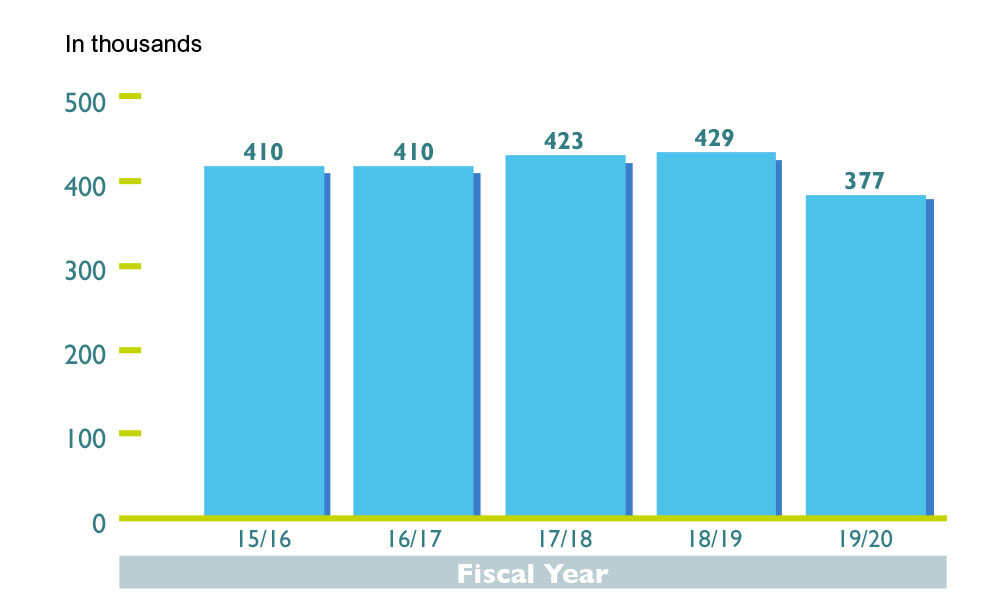
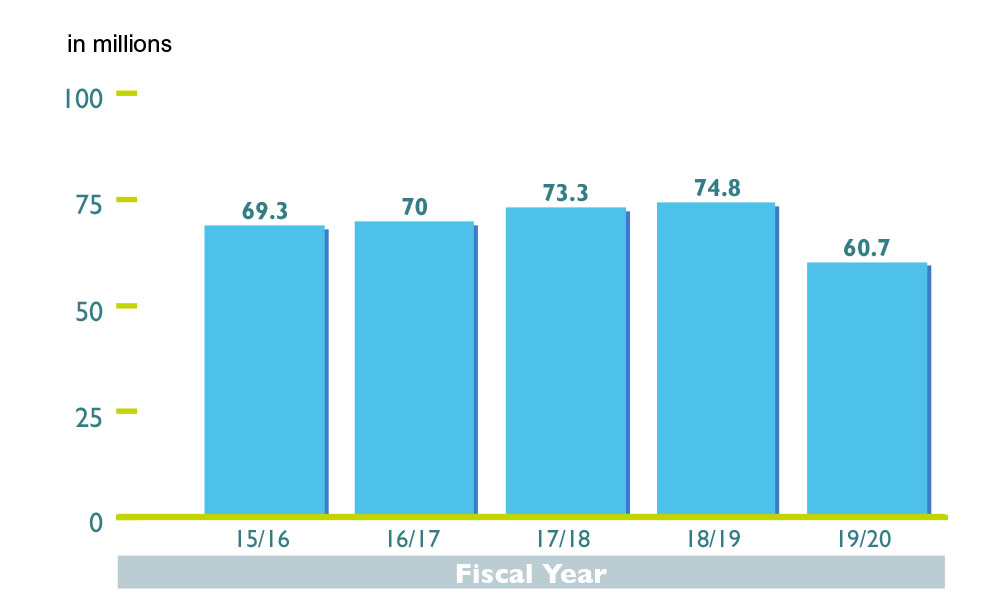
| 2015-2016 | 410 065 | 3.6% | 69 303 711 | 7.8% | 4 343 289 | -1.4% |
| 2016-2017 | 410 455 | 0.1% | 70 047 862 | 1.1% | 4 635 588 | 6.7% |
| 2017-2018 | 423 436 | 3.2% | 73 257 295 | 4.6% | 4 981 942 | 7.5% |
| 2018-2019 | 428 895 | 1.3% | 74 822 142 | 2.1% | 4 957 124 | -0.5% |
| 2019-2020 | 377 455 | -12.0% | 69 719 078 | -18.8% | 4 591 781 | -7.4% |
*
Passengers include transfer, but exclude transit passengers.
Five-Year Total Flights Handled by Air Traffic Management Division
(April 2015 – March 2020)
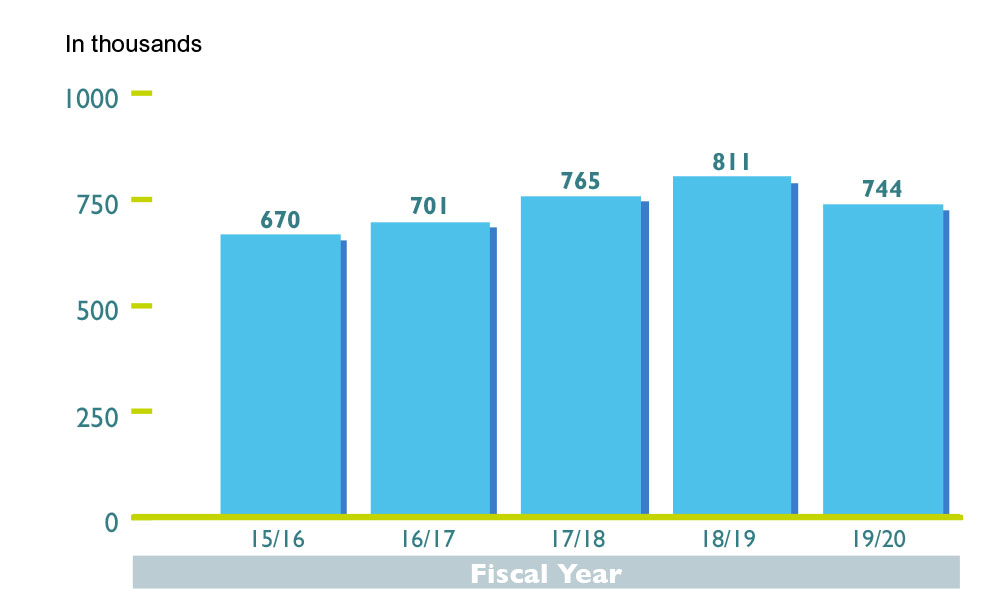
| Fiscal Year | Flights Handled* | % Change (from last fiscal year) |
|---|---|---|
| 2015-2016 | 670 481 | 6% |
| 2016-2017 | 700 868 | 5% |
| 2017-2018 | 764 824 | 9% |
| 2018-2019 | 810 817 | 6% |
| 2019-2020 | 744 197 | -8.2% |
*
"Flights Handled" is the total number of aircraft handled by the Air Traffic Management Division of CAD in the year. It includes:
(1)
international and local aircraft movements at the Hong Kong International Airport;
(2)
flights transiting the Hong Kong Flight Information Region not landing Hong Kong;
(3)
flights landing and departing the Macao International Airport handled by the Air Traffic Management Division.
Five-Year Aircraft Movement at Hong Kong International Airport
Five-Year Total Flights Handled by Air Traffic Management Division
Five-Year Passenger Traffic at Hong Kong International Airport
Five-Year Cargo Traffic at Hong Kong International Airport