Five-Year Civil International Air Traffic
(April 2019 – March 2024)
| Fiscal Year | Aircraft Movement | Passenger* | Commercial Cargo | |||
|---|---|---|---|---|---|---|
| Movement | % Change (from last fiscal year) |
Number | % Change (from last fiscal year) |
Tonnes | % Change (from last fiscal year) |
|
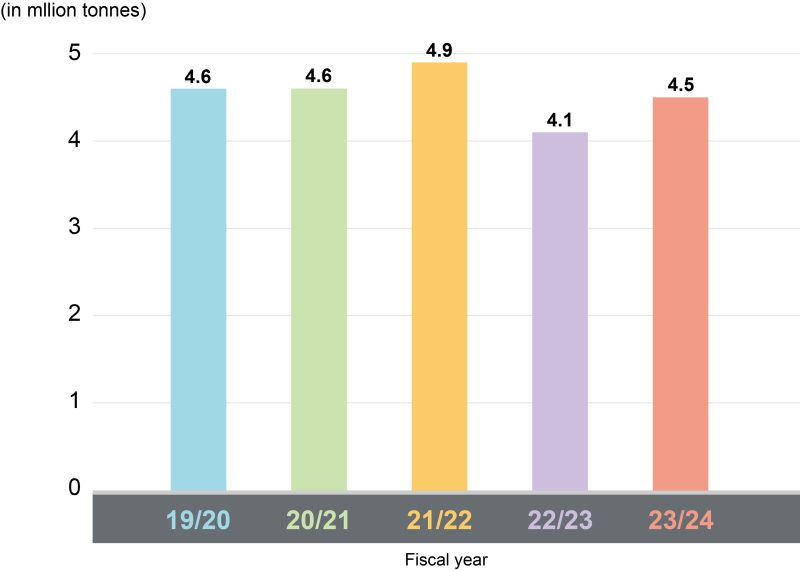
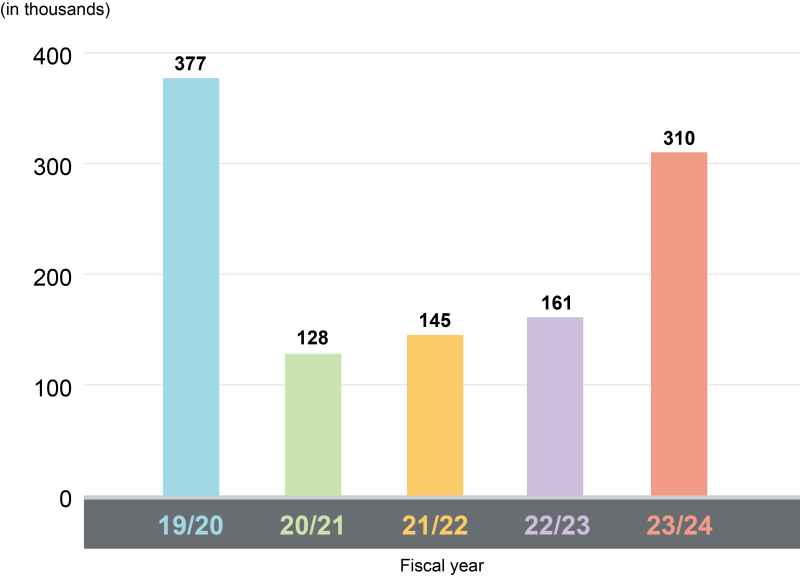
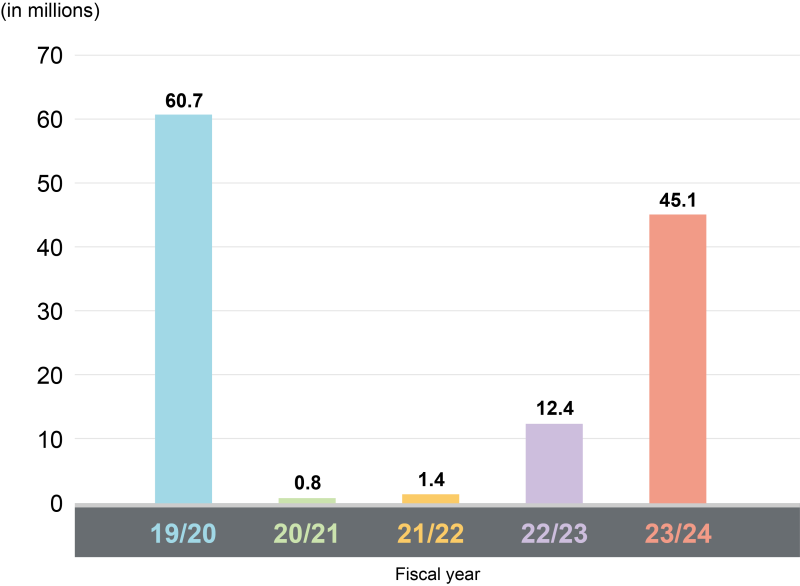
| 2019-2020 | 377 455 | -12.0% | 60 719 078 | -18.8% | 4 591 781 | -7.4% |
| 2020-2021 | 127 801 | -66.1% | 835 961 | -98.6% | 4 555 070 | -0.8% |
| 2021-2022 | 144 511 | 13.1% | 1 416 858 | 69.5% | 4 885 673 | 7.3% |
| 2022-2023 | 161 180 | 11.5% | 12 364 638 | 772.7% | 4 105 239 | -16.0% |
| 2023-2024 | 309 672 | 92.1% | 45 080 986 | 264.6% | 4 477 595 | 9.1% |
*
Passengers include transfer, but exclude transit passengers.
Five-Year Total Flights Handled by the Air Traffic Management Division
(April 2019 – March 2024)
| Fiscal Year | Flights Handled* | % Change (from last fiscal year) |
|---|---|---|
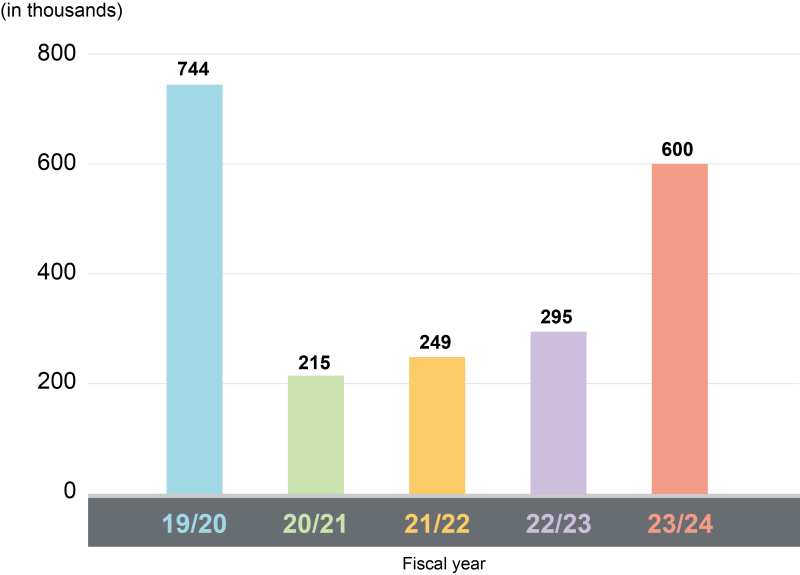
| 19/20 | 744 197 | -8.2% |
| 20/21 | 214 921 | -71.1% |
| 21/22 | 248 934 | 15.8% |
| 22/23 | 295 203 | 18.6% |
| 23/24 | 599 760 | 103.2% |
*
"Flights Handled" is the total number of aircraft handled by the Air Traffic Management Division of CAD in the year. It includes:
(1)
international and local aircraft movements at the Hong Kong International Airport;
(2)
flights transiting the Hong Kong Flight Information Region not landing Hong Kong;
(3)
flights landing and departing the Macao International Airport handled by the Air Traffic Management Division.
Five-Year Aircraft Movement at the Hong Kong International Airport
Five-Year Total Flights Handled by the Air Traffic Management Division
Five-Year Passenger Traffic at the Hong Kong International Airport
Five-Year Cargo Traffic at the Hong Kong International Airport